
ETFs vs Individual Stocks: A Scientific Guide for Beginner Investors
TL;DR — For 90%+ of beginners, a low-cost broadly-diversified ETF (e.g. an S&P 500 or MSCI World ETF) beats stock picking on a risk-adjusted basis. Decades of peer-reviewed research and the annual SPIVA Scorecard show that professional fund managers underperform their benchmark indexes 85–95% of the time over 15-year horizons. This guide explains why — using portfolio theory, real data, and a clear decision framework so you can choose the right approach for your situation.
Introduction: Why This Question Matters
If you have decided to start investing, you immediately face a fundamental fork in the road: should you buy individual stocks (Apple, Tesla, Volkswagen) or exchange-traded funds (S&P 500 ETF, MSCI World ETF)? The decision determines your fees, your tax efficiency, your time commitment, and — most importantly — your long-term risk-adjusted return.
This article is evidence-based: every claim is grounded in either Modern Portfolio Theory (Markowitz, 1952), the Efficient Market Hypothesis (Fama, 1970), the SPIVA Scorecard (S&P Dow Jones Indices, updated annually), or the Fama-French factor model. No opinions, no hype.
By the end you will understand:
- What ETFs and individual stocks actually are, mechanically
- The mathematics of diversification and why it matters
- The empirical evidence on active vs passive performance
- Fees, taxes, and frictions — the silent killer of returns
- A practical decision framework and core-satellite allocation model
1. What Is an ETF? What Is a Stock?
1.1 Individual Stocks (Equities)
A stock (or share) is a unit of ownership in a single publicly traded company. If a company has issued 1 billion shares and you own 100, you own one ten-millionth of the company. You are entitled to:
- A proportional share of profits (paid as dividends or retained in the company)
- Voting rights at the annual general meeting
- A claim on residual assets in case of liquidation (after creditors and bondholders)
Stocks trade on exchanges (NYSE, NASDAQ, XETRA, LSE) at prices that fluctuate continuously based on supply, demand, and new information.
1.2 Exchange-Traded Funds (ETFs)
An ETF is an investment fund that holds a basket of securities (typically dozens to thousands of stocks or bonds) and is itself traded on a stock exchange like a single stock. When you buy one share of VOO (Vanguard S&P 500 ETF), you economically own a tiny slice of all 500 companies in the S&P 500 index — Apple, Microsoft, Nvidia, JP Morgan, ExxonMobil, and 495 others — in proportion to their index weights.
ETFs are typically passively managed: they mechanically replicate a published index (S&P 500, MSCI World, FTSE All-World, MSCI Emerging Markets) rather than relying on a fund manager’s stock picks. This is the single biggest reason ETFs have lower fees than traditional mutual funds.
Mechanical advantages of ETFs
- Intraday liquidity — trade any time the exchange is open
- In-kind creation/redemption — keeps expense ratios low and limits taxable capital gains distributions
- Transparency — full holdings published daily
- Diversification in one trade — you do not need to manually buy 500 stocks
2. The Mathematics of Diversification
This is the technical core of the article. If you understand this section, the rest follows naturally.
2.1 Total Risk = Systematic + Idiosyncratic
Modern Portfolio Theory (Markowitz, 1952; Sharpe, 1964) decomposes the total risk (variance) of any stock into two components:
σ²(total) = σ²(systematic) + σ²(idiosyncratic)
- Systematic risk (also: market risk, undiversifiable risk) affects all stocks — recessions, interest-rate shocks, pandemics. It cannot be diversified away.
- Idiosyncratic risk (also: firm-specific risk, diversifiable risk) is unique to one company — a failed product launch, a CEO scandal, an accounting fraud. It can be eliminated by holding many uncorrelated stocks.
The crucial insight from the Capital Asset Pricing Model (CAPM): the market only compensates you for bearing systematic risk. Idiosyncratic risk earns you zero expected excess return — it is risk you take for free. Eliminating it is therefore a free lunch.
2.2 How Many Stocks Do You Need?
| Study | Year | Stocks needed for ~90% diversification |
|---|---|---|
| Evans & Archer | 1968 | ~15 |
| Statman | 1987 | 30–40 |
| Campbell, Lettau et al. | 2001 | 50+ |
| Statman (revised) | 2004 | 120+ |
| Domian, Louton & Racine | 2007 | 300+ |
Modern markets show higher firm-specific volatility than in the 1960s, so the “you only need 15 stocks” rule from the Evans & Archer paper is outdated. Recent research (Domian et al., 2007) concludes you need 300+ stocks to be confident of eliminating idiosyncratic risk.
A single broad-market ETF such as VT (Vanguard Total World) holds ~9,000 stocks across 49 countries. You achieve in one trade what would otherwise require months of work and tens of thousands of euros in trading commissions.
2.3 The Concentration Trap
Beginner stock pickers typically end up with 3–10 individual positions. Empirically, this leaves them with 40–70% of variance coming from idiosyncratic risk — risk for which the market pays no premium. They are taking large risks for no expected reward.
3. The Empirical Evidence: Active vs Passive
3.1 The SPIVA Scorecard
The S&P Indices Versus Active (SPIVA) Scorecard is the most cited dataset in this debate. It compares actively managed mutual funds to their benchmark index, net of fees, and corrects for survivorship bias. Latest published results (SPIVA US Year-End 2023):
| Time Horizon | % of US Large-Cap Active Funds Underperforming S&P 500 |
|---|---|
| 1 year | 60% |
| 5 years | 79% |
| 10 years | 87% |
| 15 years | 92% |
| 20 years | 94% |
The longer the time horizon, the worse active managers do. The same pattern holds in European, emerging-market, and small-cap segments.
If professional managers with PhDs, Bloomberg terminals, and teams of analysts underperform the index 92% of the time over 15 years, the realistic prior for an individual retail investor picking stocks in their spare time is worse, not better.
3.2 Why Active Management Underperforms (Three Causes)
- Costs. Active funds charge 0.5–2.0% annually. The index does not.
- The arithmetic of active management (Sharpe, 1991): in aggregate, active investors must earn the market return before costs and therefore must underperform after costs. This is mathematically guaranteed.
- Behavioral errors. DALBAR’s Quantitative Analysis of Investor Behavior consistently shows retail investors underperform the funds they invest in by 1.5–3% per year due to performance chasing — selling low, buying high.
3.3 The Buffett Bet
In 2007, Warren Buffett publicly bet $1 million that an S&P 500 index fund (Vanguard’s VFIAX) would beat a portfolio of five hand-picked hedge funds over 10 years, net of fees. Final result (2017): Index fund +125.8%; hedge funds +36.3%. Buffett donated the winnings to charity.
4. The True Cost of Fees
Fees compound against you the same way returns compound for you. A 1% extra annual fee does not cost you 1% — over decades it costs dozens of percent of your final wealth.
4.1 The Math
Future value formula:
FV = PV × (1 + r − c)^n
Where r = gross return, c = annual cost (expense ratio + spread + tax drag), n = years.
Over 40 years at 7% gross, with €10,000 invested once:
| Annual cost | Net return | Final value | Lost to fees |
|---|---|---|---|
| 0.05% (ETF) | 6.95% | €146,487 | — |
| 1.00% | 6.00% | €102,857 | €43,630 |
| 1.50% (active mutual fund) | 5.50% | €85,136 | €61,351 |
| 2.00% | 5.00% | €70,400 | €76,087 |
A 1.45 percentage-point fee differential erases ~42% of your potential ending wealth over 40 years.
This is why John Bogle called it the “cost matters hypothesis”: minimizing investment costs is the single most reliable, controllable lever for improving lifetime returns.
5. Head-to-Head Comparison
| Dimension | Broad-Market ETFs | Individual Stocks |
|---|---|---|
| Diversification | Instant (500–9,000 holdings) | Manual; expensive at scale |
| Expense ratio | 0.03–0.20% / year | 0% (but trading costs & spreads) |
| Time required | Minutes per year | Hours per week (analysis, news, filings) |
| Required knowledge | Minimal (index choice, allocation) | High (accounting, valuation, sector dynamics) |
| Tax efficiency (US/EU) | High (in-kind redemption) | High (full control over realization) |
| Tax-loss harvesting | Possible at ETF level | Easier at position level |
| Expected risk-adjusted return | Market return − tiny fee | Market return − fees − behavior gap (usually negative alpha) |
| Worst-case loss | ~50% drawdown (entire market) | Up to 100% (single-company failure) |
| Voting rights | Delegated to fund provider | Direct |
| Dividend control | Pass-through (cash or accumulating) | Direct |
| Emotional difficulty | Lower (no individual-company anxiety) | Higher (concentration, news cycles) |
6. When Individual Stocks Actually Make Sense
A scientific answer is not never — it is under specific conditions. Picking individual stocks is rational if at least three of the following are true:
- You can devote 5+ hours per week to fundamental analysis.
- You have a verifiable information edge in a specific industry (e.g. you are a semiconductor engineer evaluating ASML).
- You can hold a position for 5+ years without selling on bad news.
- You will own a diversified basket of 30+ uncorrelated stocks, not 3–5 conviction bets.
- You commit no more than the satellite portion (5–20%) of total invested wealth to active picks.
- You measure performance against a benchmark (e.g. S&P 500 total return) and exit if you underperform over 5+ years.
If fewer than three apply, the expected value of stock picking is negative versus a simple ETF strategy.
7. A Practical Decision Framework: Core-Satellite
Most evidence-based investors (including endowments, pension funds, and academic literature) converge on a core-satellite structure:
┌─────────────────────────────────────────────┐
│                   PORTFOLIO                 │
├──────────────────────┬──────────────────────┤
│  CORE (80–95%)       │  SATELLITE (5–20%)   │
│  Diversified ETFs    │  Individual stocks,  │
│                      │  thematic ETFs,      │
│  e.g.                │  sector bets         │
│  • MSCI World        │                      │
│  • S&P 500           │                      │
│  • FTSE All-World    │                      │
│  • Bond ETF          │                      │
└──────────────────────┴──────────────────────┘
The core captures market returns reliably and cheaply. The satellite lets you express convictions, learn by doing, and potentially add alpha — without endangering retirement.
7.1 Sample Beginner Portfolios
Defensive (low risk tolerance):
- 60% MSCI World ETF (e.g.
IWDA/URTH) - 30% Global aggregate bond ETF (e.g.
AGGG) - 10% Cash / money-market fund
Balanced (medium risk tolerance):
- 70% FTSE All-World ETF (e.g.
VWCE/VT) - 20% Emerging Markets ETF (e.g.
EIMI/VWO) - 10% Bond ETF
Growth (long horizon, high risk tolerance):
- 80% FTSE All-World or MSCI ACWI ETF
- 10% Small-cap or factor ETF (e.g.
IUSN,AVUV) - 10% Satellite individual stocks
Disclaimer. This article is for educational purposes only. It is not personalized investment advice. Consider your own goals, time horizon, and tax situation, and consult a licensed advisor where appropriate.
8. Common Pitfalls (and How to Avoid Them)
- Overconcentration in employer stock. Holding 50% of net worth in your employer combines wage risk + investment risk.
- Chasing performance. Buying last year’s best-performing fund or stock has been shown to predict future underperformance (Carhart, 1997).
- Panic selling. The biggest behavioral cost. Automating contributions and ignoring daily prices is empirically the single highest-impact intervention.
- Ignoring fees, focusing on returns. A 1.5% fund that returned 10% last year often loses to a 0.05% ETF that returned 9.8%.
- Lottery-ticket bias. Loading up on a few “moonshot” stocks (meme stocks, single-product biotechs) feels exciting but is mathematically a high-variance, negative-expected-value strategy for most.
- Confusing “low price per share” with “cheap.” Share price is meaningless; valuation multiples (P/E, EV/EBIT) and risk-adjusted return are what matter.
9. How to Get Started (Practical Steps)
First, check how much of your money can stay invested through a downturn. My emergency fund versus investing guide separates essential cash reserves from long-term investments and works through a household budget in euros.
- Open a brokerage account in your jurisdiction. In Germany: Trade Republic, Scalable Capital, ING, Comdirect; in the US: Vanguard, Fidelity, Schwab.
- Decide your asset allocation (equity vs bonds vs cash) based on time horizon and risk tolerance.
- Choose 1–3 broad ETFs for the core. For most Europeans, a single accumulating MSCI World or FTSE All-World UCITS ETF is enough.
- Set up an automatic monthly investment plan (Sparplan). Frequency: monthly. Amount: whatever is sustainable.
- Ignore the market for years at a time. Rebalance once per year.
- (Optional) Allocate a satellite if and only if the conditions in Section 6 apply.
10. Conclusion
The scientific evidence is unambiguous for the typical beginner:
- Markets are largely (not perfectly) efficient → consistent stock-picking alpha is rare and hard to identify ex ante.
- Diversification eliminates uncompensated risk → broad ETFs dominate concentrated portfolios on a risk-adjusted basis.
- Fees compound against you → low-cost passive funds win the long-term math.
- Behavior is the dominant source of underperformance → simple, automatic, boring strategies outperform clever ones.
For most beginners, the optimal approach is: buy a low-cost broadly-diversified ETF, automate monthly contributions, and let compounding do the work for 20–40 years. If you want to pick individual stocks, do so consciously — as a small satellite, with rigorous benchmarking, and with eyes open to the empirical odds.
Investing is not about being clever. It is about being consistent, low-cost, and diversified — for a very long time.
Further Reading & Resources
Books for further reading
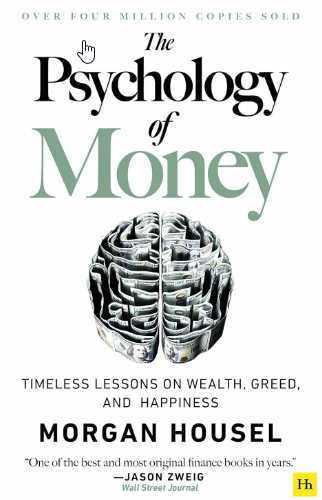
By: Burton G. Malkiel
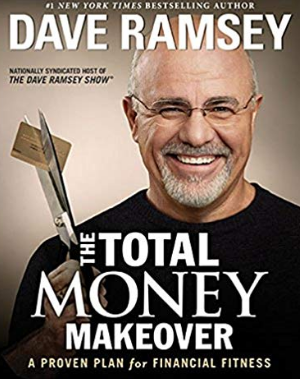
By: John C. Bogle
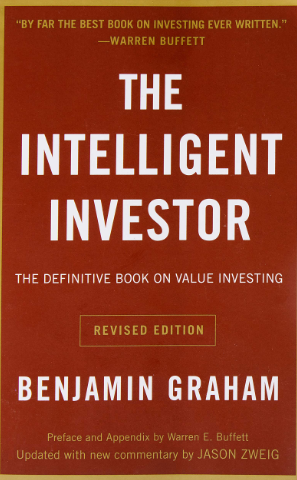
By: Benjamin Graham
By: Morgan Housel
Videos for further infos
 Index Funds vs Individual Stocks — Ben Felix
 How to Invest in ETFs for Beginners
 Warren Buffett on Index Funds vs Stock Picking
Primary sources & peer-reviewed research
- SPIVA Scorecard — S&P Dow Jones Indices, updated semi-annually. The definitive dataset on active vs passive fund performance.
- Markowitz, H. (1952). Portfolio Selection. Journal of Finance, 7(1), 77–91. Founding paper of Modern Portfolio Theory.
- Sharpe, W. F. (1964). Capital Asset Prices: A Theory of Market Equilibrium under Conditions of Risk. Journal of Finance, 19(3), 425–442. Origin of the CAPM.
- Fama, E. F. (1970). Efficient Capital Markets: A Review of Theory and Empirical Work. Journal of Finance, 25(2), 383–417.
- Sharpe, W. F. (1991). The Arithmetic of Active Management. Financial Analysts Journal, 47(1), 7–9.
- Carhart, M. M. (1997). On Persistence in Mutual Fund Performance. Journal of Finance, 52(1), 57–82.
- Domian, D., Louton, D., & Racine, M. (2007). Diversification in Portfolios of Individual Stocks: 100 Stocks Are Not Enough. Financial Review, 42(4), 557–570.
- DALBAR Inc. Annual Quantitative Analysis of Investor Behavior (QAIB) report.